


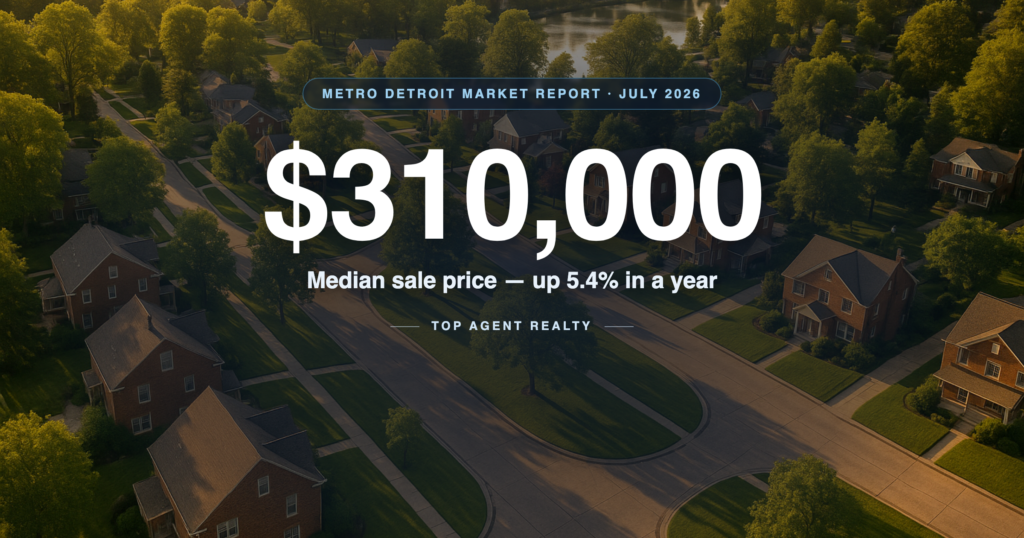
Metro Detroit’s median sale price reached $310,000 in June 2026, up 5.4% from a year ago, per Realcomp MLS single-family data. Closed sales across Oakland, Macomb and Wayne counties rose 3.6% to 4,779, inventory hit a five-year high, and the average listing sold in 26 days.
We publish this report each month once Realcomp releases the prior month’s data, layering in Redfin, Zillow Research and Federal Reserve (FRED) figures. Every number below is sourced and dated; see Methodology & sources. Our agents work these cities every day, so where the raw numbers can mislead (and a few this month can), we say so.
What is the median home price in Metro Detroit right now?
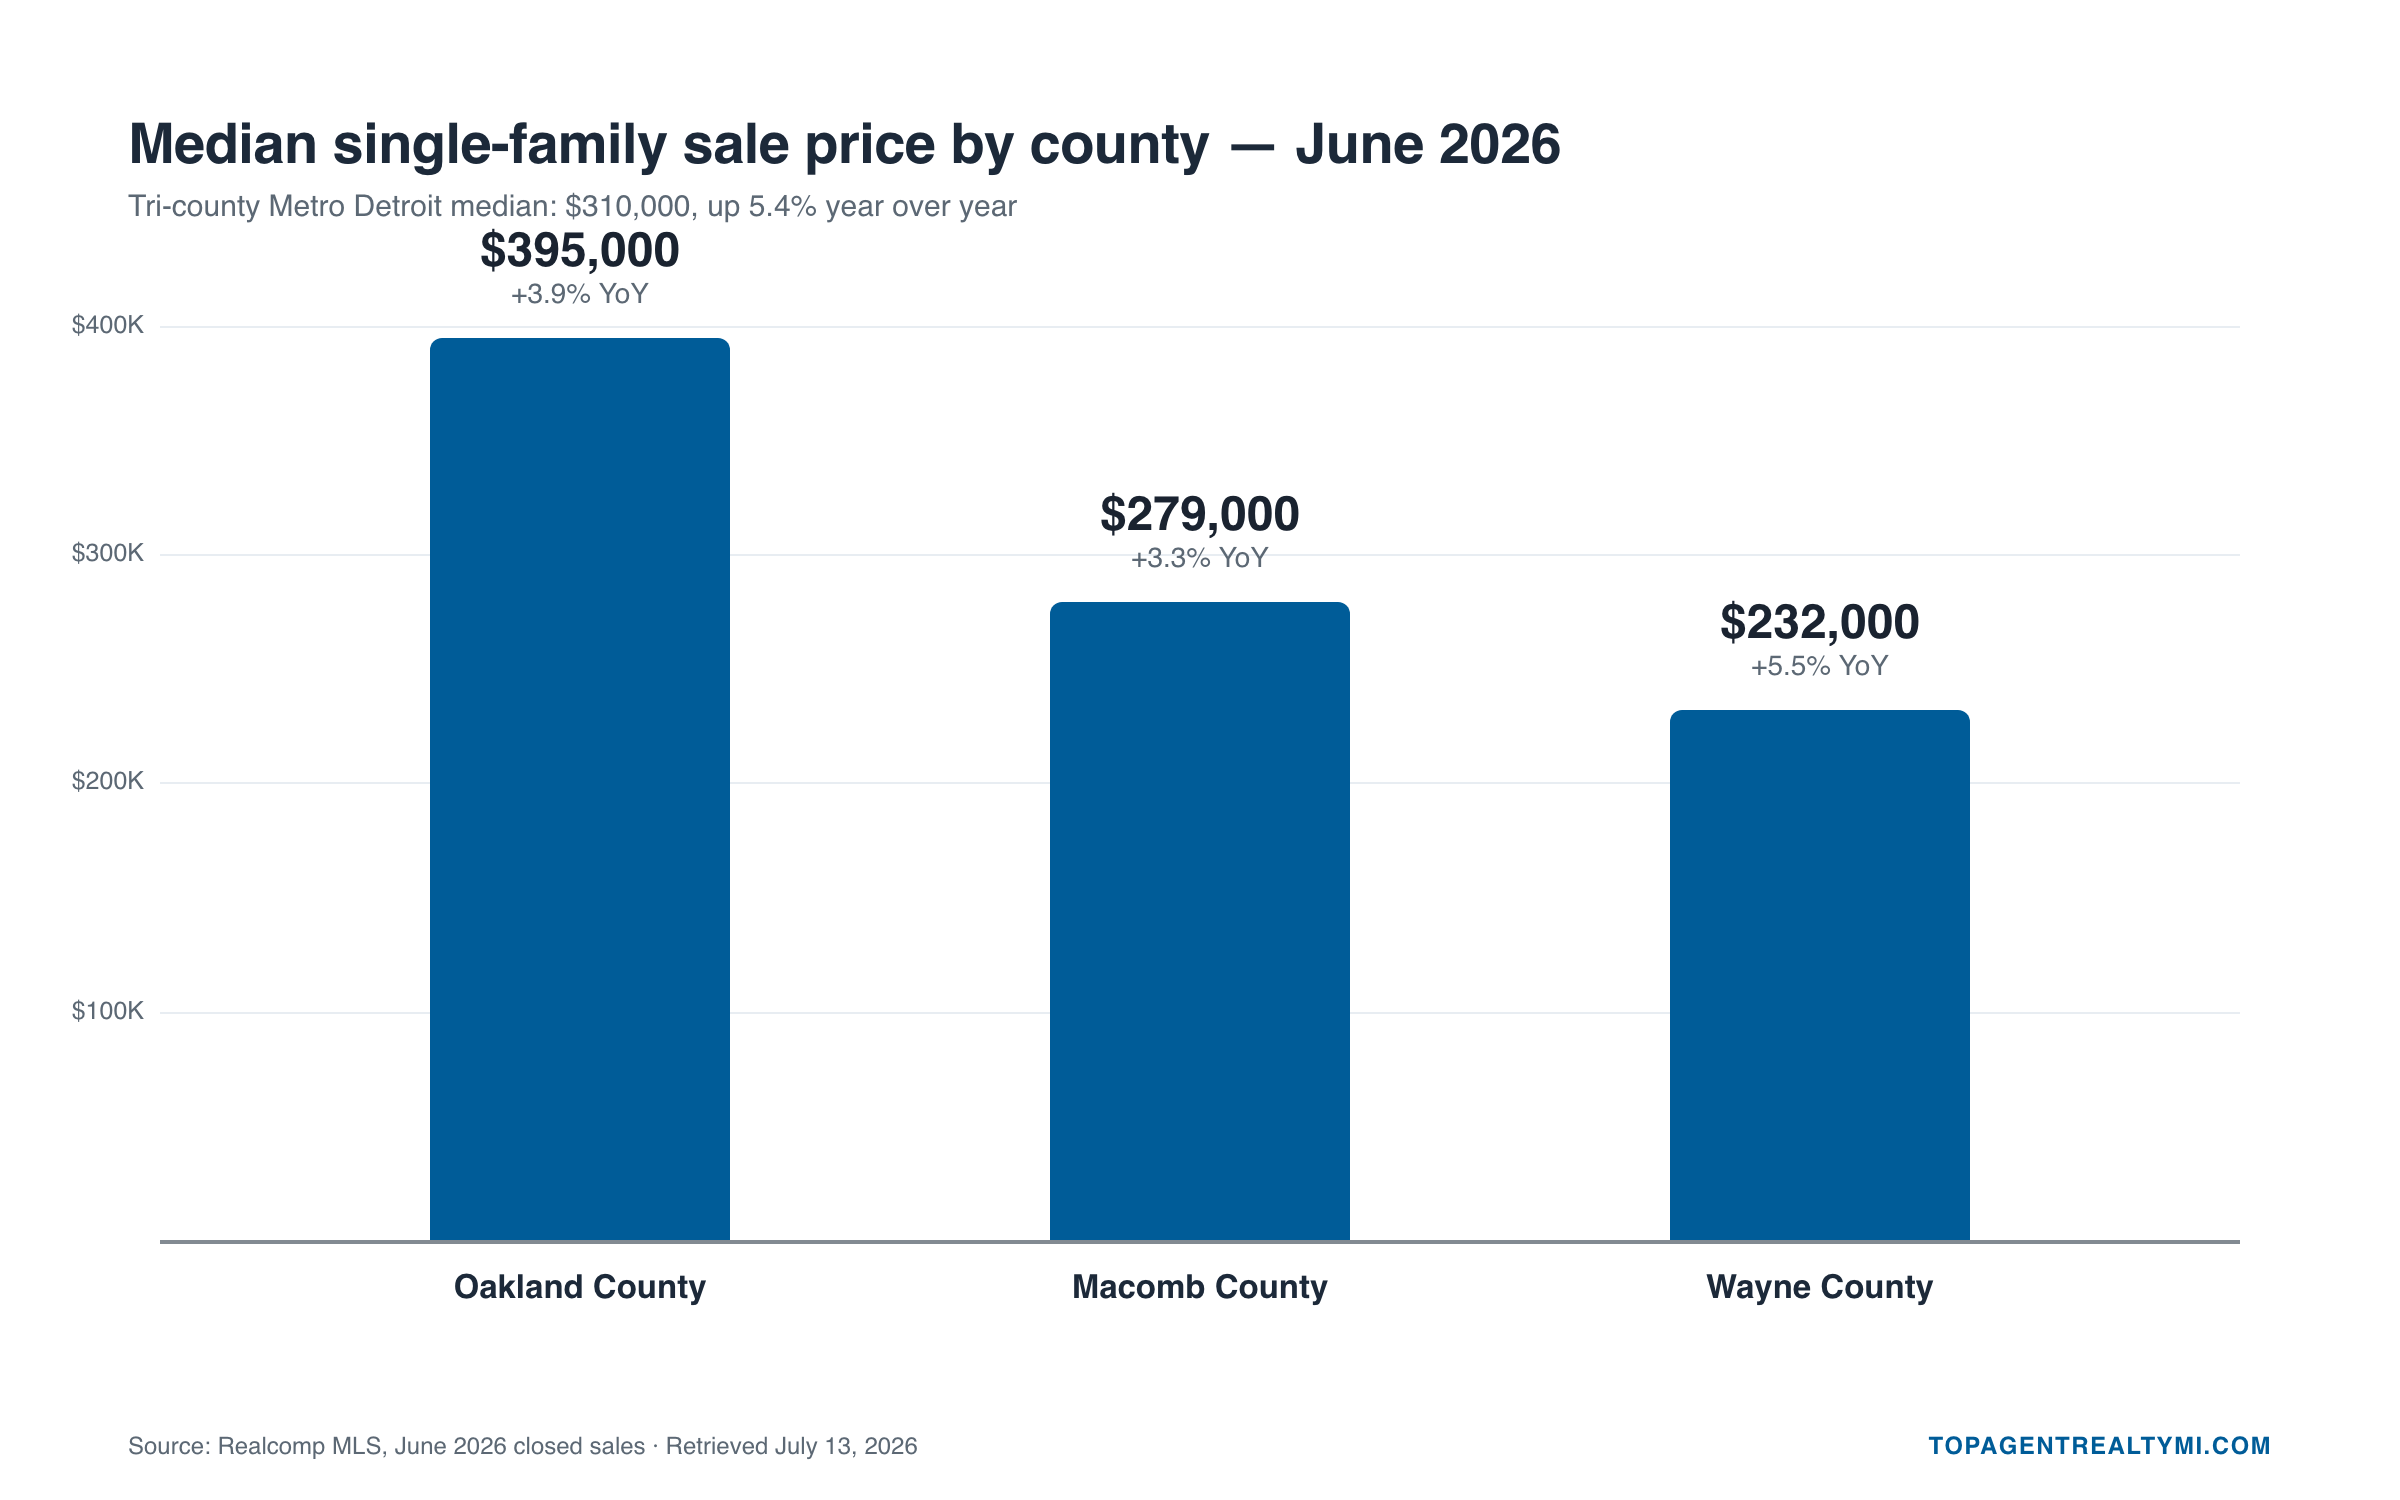
As of June 2026, the median single-family sale price across the tri-county Metro Detroit area is $310,000, per Realcomp, up 5.4% year over year. County by county: Oakland $395,000, Macomb $279,000, Wayne $232,000. Across Realcomp’s full southeast Michigan footprint, the $309,000 median is an all-time high, up 4.8%.
Table A: County rollup, June 2026 (single-family)
| County | Median sale price | YoY | Closed sales | Sales YoY | Avg. days on market | Active listings | Months of supply | Sale-to-list |
|---|---|---|---|---|---|---|---|---|
| Oakland | $395,000 | +3.9% | 1,735 | +9.1% | 23 | 3,414 | 2.0 | 100.2% |
| Macomb | $279,000 | +3.3% | 1,063 | −0.9% | 25 | 2,210 | 2.1 | 99.7% |
| Wayne | $232,000 | +5.5% | 1,689 | −0.2% | 29 | 4,831 | 2.9 | 99.1% |
| Metro Detroit (tri-county) | $310,000 | +5.4% | 4,779 | +3.6% | 26 | 10,967 | 2.3 | — |
Source: Realcomp II Ltd., June 2026 Listing and Sales Summary Report (current as of July 8, 2026), pulled July 13, 2026. Sale-to-list ratio comes from Redfin county pages (all home types, June 2026). Months of supply is computed as active listings divided by June closed sales.
Context that doesn’t fit in a table: Realcomp counted 11,132 closed single-family sales MLS-wide in June (the highest June total in three years), and roughly three of every ten homes listed in June went pending within the same month.
Is it a buyers or sellers market in Michigan right now?
Michigan remains a moderate sellers market in June 2026, but it is loosening. Metro Detroit inventory sits at a five-year high: 25,885 active listings MLS-wide, up 12.6% year over year. Yet supply across the MLS is still only 2.9 months, well under the 4–6 months of a balanced market, and sellers still average 99.7% of asking price.
Those two facts sound contradictory. They aren’t. Sellers of well-priced homes in Troy, Royal Oak or Sterling Heights are still fielding multiple offers inside two weeks. But the leverage gap is narrowing: active listings rose 7% in a single month (May to June), pending sales are down 4.7% year over year, and months of supply climbed 7.4% month over month. “More homes coming to market led to homes selling in June at significant levels once again,” Realcomp CEO Karen Kage said in the June release. More sellers are showing up precisely because conditions still favor them. Expect “sellers market, shrinking margin” to be the story for the rest of the summer.
Average Home Price in Detroit vs. Metro Detroit
Buyers searching for the average home price in Detroit often land on regional reports quoting the full Metro Detroit figure, which is misleading. Here is the city-specific breakdown from the same June 2026 MLS data set:
- City of Detroit: $105,500 median sale price, 429 sales, up 0.6% year over year
- Metro Detroit (Oakland, Macomb, and Wayne counties combined): $310,000 median, up 5.4% year over year
The gap reflects Detroit’s lower per-sale price point relative to higher-cost suburban markets such as Birmingham and Bloomfield Hills, which pull the three-county regional median up.
Are home prices in Oakland County rising or falling?
Rising. Oakland County’s median single-family sale price hit $395,000 in June 2026, up 3.9% from $380,000 a year earlier, per Realcomp. Sales jumped 9.1% to 1,735 closings, the strongest gain of the three counties, while active listings rose 15.2% to 3,414, roughly two months of supply at the current sales pace.
Oakland is Metro Detroit’s bellwether: the biggest county by dollar volume and the one with the widest spread, from Southfield’s $245K median to Birmingham north of $1M (Table B). At 23 average days on market, quickest of the three counties, demand is clearly absorbing the extra inventory. If you’re weighing a move within the county, our Troy community guide and Birmingham community guide cover the two ends of that price spectrum.
How fast are homes selling in Macomb and Wayne County?
Fast. Macomb County single-family homes averaged 25 days on market in June 2026, two days quicker than a year ago; Wayne County averaged 29, unchanged, per Realcomp. Metro-wide the average was 26 days, and nearly three in ten homes listed in June went pending within the same month.
Macomb’s median rose 3.3% to $279,000 on 1,063 closings. It’s the steadiest of the three counties: Warren and Sterling Heights give first-time buyers the metro’s best price-per-square-foot on brick ranches, which is why well-priced listings there rarely see a second weekend. Wayne posted the largest price gain of the three counties, up 5.5% to $232,000, with the important footnote that the City of Detroit itself (429 sales, $105,500 median, +0.6%) trades very differently from suburbs like Livonia, Canton and Northville. Livonia is currently the fastest market of our 15 tracked cities at 15 days (Table B).
Which Metro Detroit suburbs have the biggest price gains this year?
By smoothed Zillow home values (May 2026), Birmingham leads our 15 tracked cities at +6.3% year over year, followed by Northville (+5.4%), Rochester (+3.7%) and Rochester Hills (+3.6%). Setting aside Birmingham’s mix-driven +46.4% (explained below), Brighton (+17.0%) and Novi (+12.9%) posted the biggest median jumps in raw June closings.
Table B: 15-city snapshot: June 2026 sales (Redfin) + May 2026 home values (Zillow ZHVI)
| City | Median sale price | YoY | Homes sold | Days on market | $/sq ft | ZHVI | ZHVI YoY |
|---|---|---|---|---|---|---|---|
| Troy | $468,000 | +6.4% | 82 | 27 | $218 | $467,709 | +2.7% |
| Warren | $231,000 | +4.8% | 176 | 34 | $142 | $202,195 | +2.1% |
| Sterling Heights | $315,000 | −2.8% | 139 | 26 | $180 | $313,518 | +2.9% |
| Rochester Hills | $463,000 | 0.0% | 89 | 27 | $210 | $476,685 | +3.6% |
| Northville | $440,000 | −7.4% | 11 | 53 | $240 | $600,731 | +5.4% |
| Birmingham | $1,020,000 | +46.4% | 38 | 54 | $382 | $750,135 | +6.3% |
| Shelby Township | — | — | — | — | — | $412,334 | +3.2% |
| Royal Oak | $390,000 | +8.2% | 137 | 26 | $267 | $338,048 | +2.6% |
| Livonia | $326,000 | −0.4% | 130 | 15 | $181 | $318,715 | +2.8% |
| Novi | $548,000 | +12.9% | 90 | 25 | $212 | $476,691 | +3.2% |
| Brighton | $403,000 | +17.0% | 26 | 29 | $218 | $441,812 | +2.5% |
| Farmington Hills | $395,000 | −4.8% | 97 | 27 | $176 | $394,714 | +2.8% |
| Canton | $400,000 | −2.4% | 121 | 27 | $194 | $408,696 | +1.9% |
| Rochester | $515,000 | −7.6% | 24 | 29 | $219 | $497,698 | +3.7% |
| Southfield | $245,000 | −4.3% | 55 | 47 | $152 | $255,778 | +2.0% |
Source: Redfin city market data (all home types, most recent month = June 2026), pulled July 13, 2026; Zillow Home Value Index (ZHVI, smoothed/seasonally adjusted, mid-tier), May 31, 2026 release, pulled July 13, 2026. Data notes: Northville, Birmingham, Brighton and Rochester each close fewer than about 40 sales a month, so their single-month medians swing with the mix of homes that happened to sell; lean on the Zillow trend columns for those cities. Redfin does not publish usable Shelby Township sale data, so that row shows the Zillow home-value trend only (see Methodology).
How to read the two YoY columns like an agent does: the Redfin column is what actually closed last month; the ZHVI column is what a typical home is worth, smoothed. Birmingham’s +46.4% doesn’t mean Birmingham homes appreciated 46%; it means June’s 38 closings skewed heavily to the luxury end. Its real trend is the +6.3% ZHVI figure, still the strongest of the cities we track. Same logic in reverse for Northville and Rochester: single-month medians fell on a handful of sales, while underlying values rose 5.4% and 3.7%. Where both columns agree, the momentum is genuine: Troy (+6.4% closed, +2.7% ZHVI), Novi (+12.9%, +3.2%) and Royal Oak (+8.2%, +2.6%). Brighton’s jump comes with a Livingston County tailwind: the county’s median rose 4.9% to $425,000 on 13.6% more sales (Realcomp).
Is June 2026 a good time to sell a house in Metro Detroit?
Yes, June 2026 still favors sellers, with a caveat. Sellers MLS-wide averaged 99.7% of asking price in June, and supply remains under three months. But inventory is at a five-year high and rising 12.6% year over year, so overpriced listings sit. Price to the comps and you’ll sell fast.
The caveat deserves numbers. A year ago, your listing competed against roughly 23,000 others MLS-wide; today it’s nearly 26,000. In Oakland County alone, active listings are up 15.2%. The sellers winning in this market are pricing at, not above, the last 90 days of comparable sales and letting competition do the rest; nearly a third of June’s new listings went pending the same month. The ones sitting are anchored to a neighbor’s 2024 price. Our breakdown of what selling actually costs in Michigan covers commission, transfer tax and closing fees line by line.
Is June 2026 a good time to buy a home in Metro Detroit?
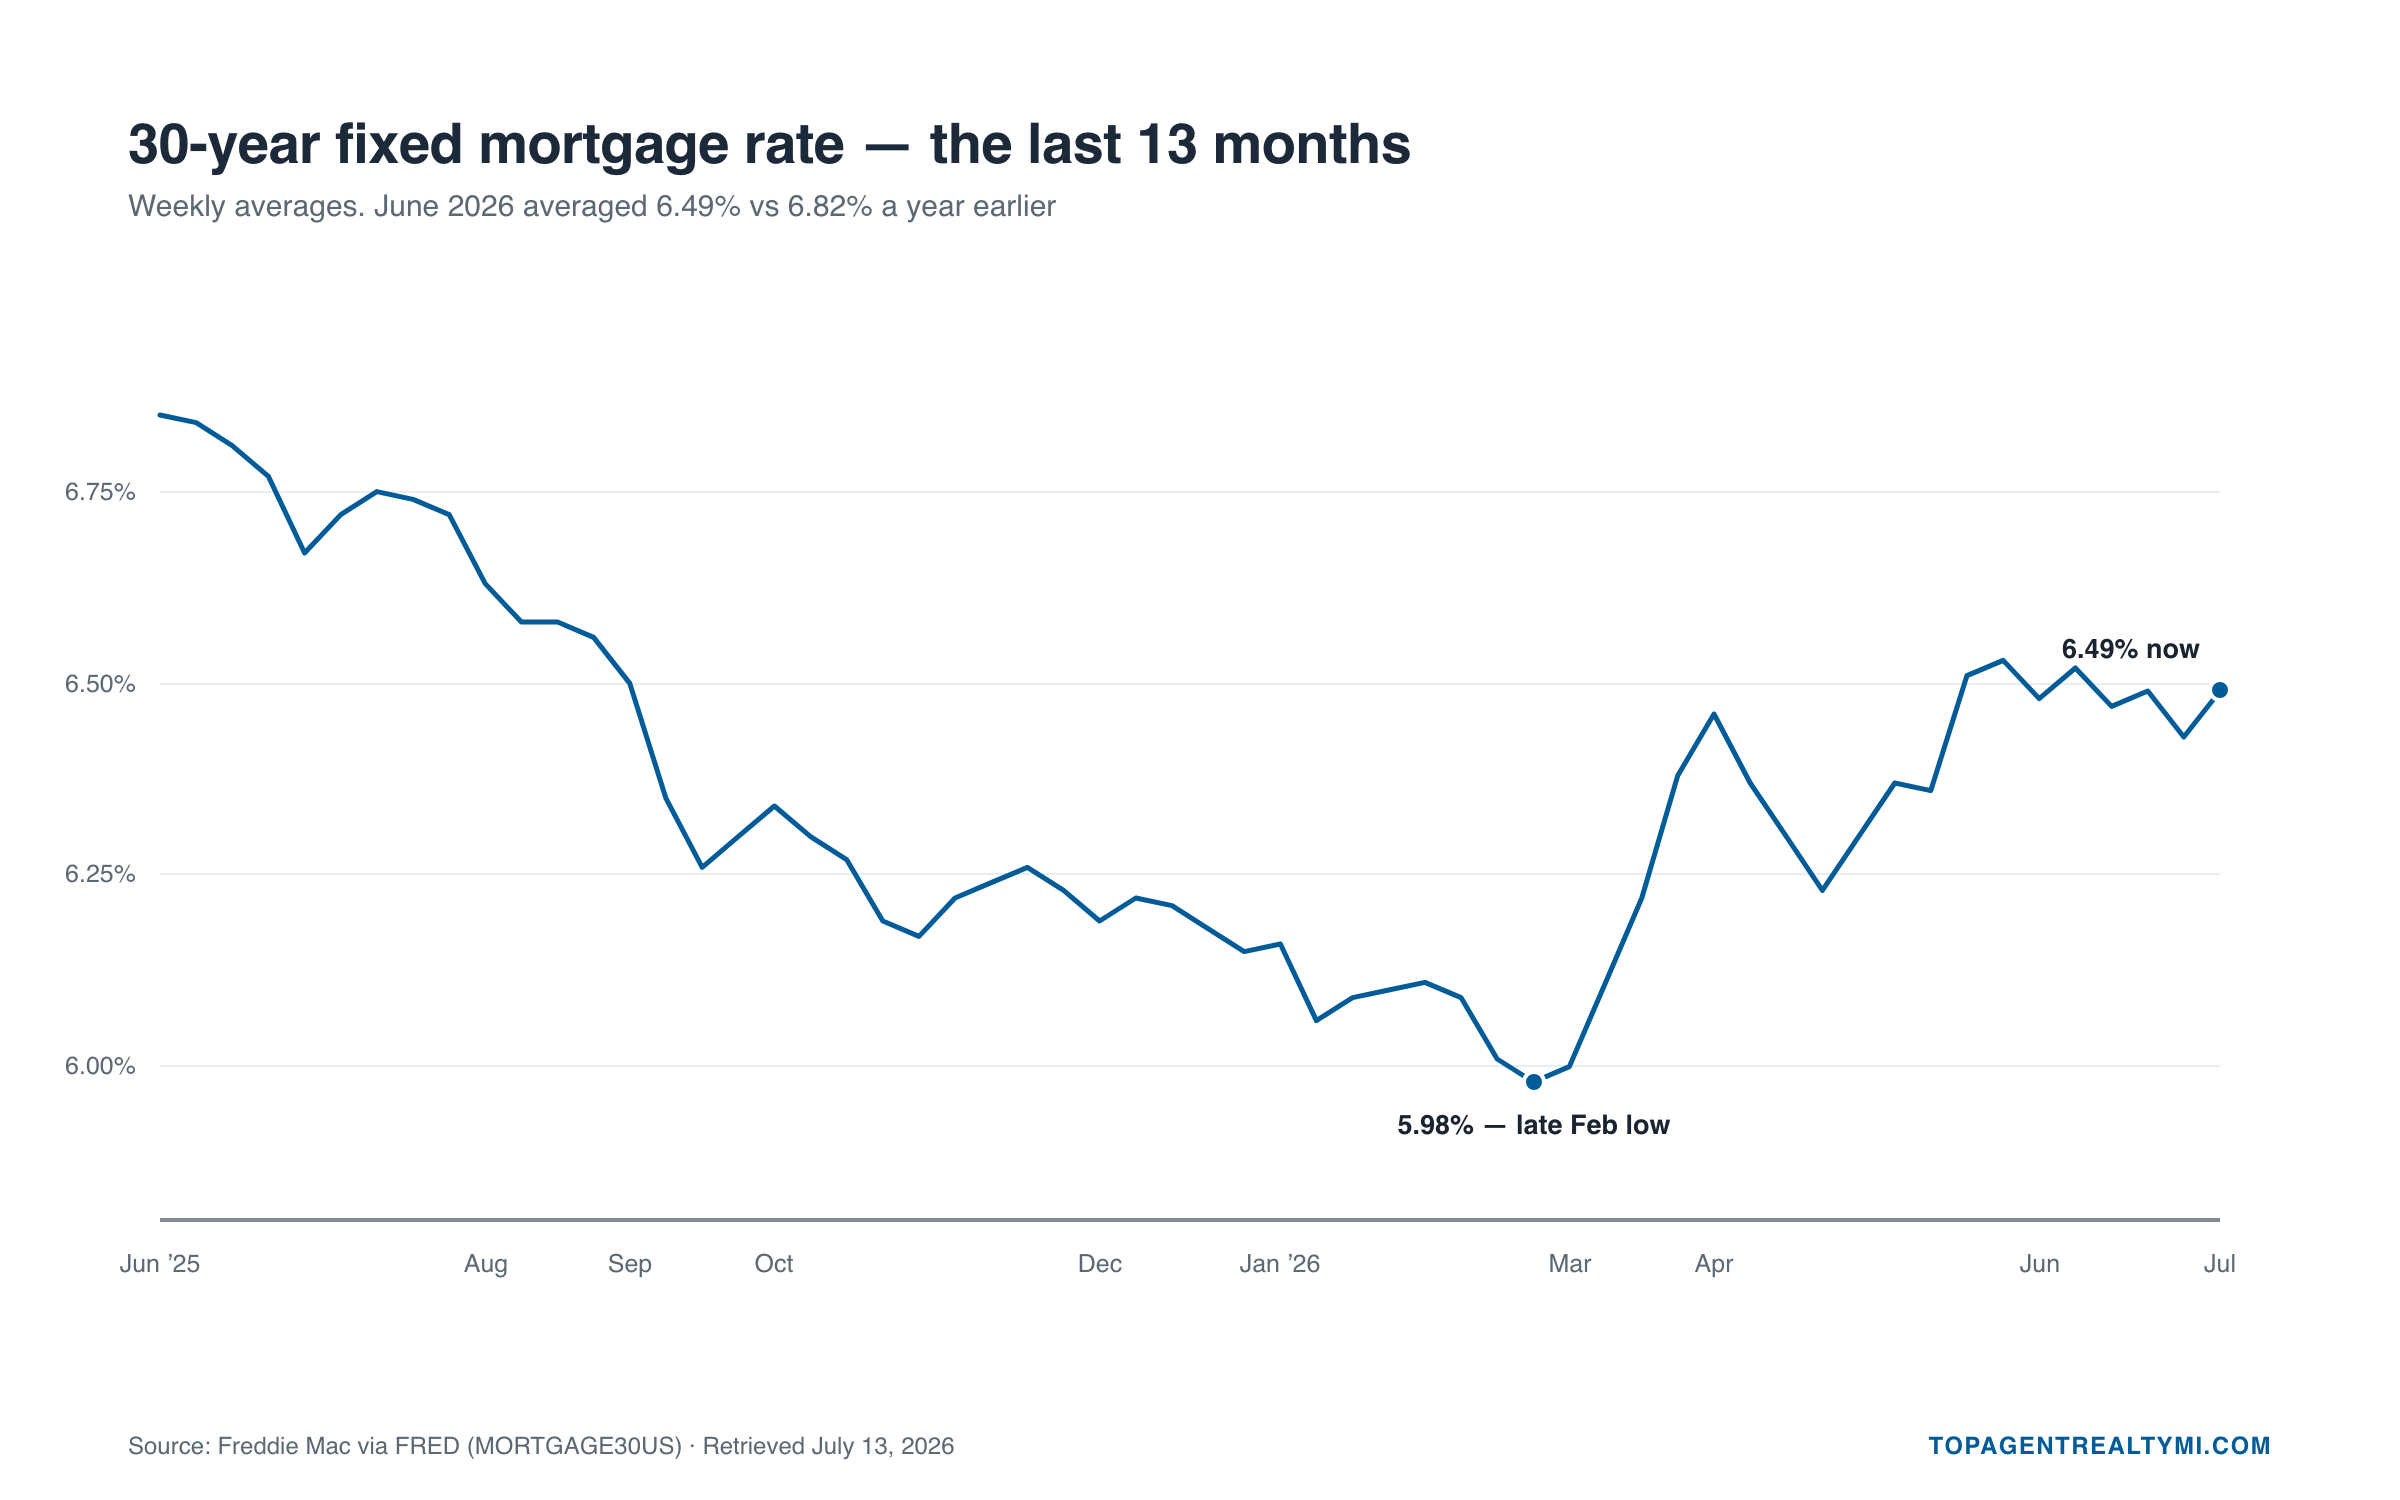
Buyers have more to choose from than in any early summer since 2021: 25,885 active listings across the MLS, up 12.6% from last June. Rates help too: the 30-year fixed averaged 6.49% in June 2026, down from 6.82% a year ago, holding the typical payment increase to about $30 a month even though prices rose 5.4%.
Table C: Rates & affordability, June 2026 vs June 2025
| Metric | June 2026 | June 2025 | Change |
|---|---|---|---|
| 30-yr fixed rate (monthly avg) | 6.49% | 6.82% | −0.33 pts |
| Metro Detroit median sale price | $310,000 | $294,000 | +5.4% |
| Est. P&I payment, 20% down | $1,566/mo | $1,536/mo | +$30 (+1.9%) |
Sources: Freddie Mac Primary Mortgage Market Survey via FRED (MORTGAGE30US), weekly values averaged by month, pulled July 13, 2026; Realcomp medians as above. Payment is principal + interest only; formula in Methodology.
At the county medians, principal and interest on a 20%-down purchase at June’s average rate runs about $1,995/month in Oakland, $1,409 in Macomb and $1,172 in Wayne, before taxes and insurance, which in Michigan you should budget carefully given summer/winter tax bills. Buyers finally have room to negotiate on homes that have sat past 30 days, and more to choose from in every bracket. If you’re shopping your first home, start with our guide to the best Detroit suburbs for first-time buyers, then browse the Novi and Warren community pages, opposite ends of the budget, both under 26 days on market.
What’s the outlook for the rest of 2026?
Expect more of the same through year-end: modest price growth in the low single digits, gradually rising inventory, and rates in the mid-6s. Realcomp’s MLS-wide supply reading of 2.9 months, up 7.4% month over month, is still well short of a balanced market, so a 2026 price decline looks unlikely absent a rate shock.
The trend worth watching is the pace of inventory growth. Listings are up 12.6% year over year while pendings are down 4.7%; if that spread persists into fall, buyers will enter 2027 with real leverage for the first time in years. We took a longer view of where Michigan is headed in our Michigan Housing Market Update 2026; this report is the monthly data companion to that piece. Check back for the July edition once Realcomp releases next month’s data.
One cost this report does not cover: property tax. It varies far more between Metro Detroit cities than sale prices do, and it is levied on taxable value rather than the prices above, so the seller’s current bill is rarely what a buyer ends up paying. Our sister site publishes the 2025 homestead millage for every school district across 45 Michigan cities, converted into what it actually costs as a share of purchase price. The range runs from 0.99% to 3.52%, which on a $310,000 home is a difference of about $7,800 every year.
FAQ
What is the average home price in Metro Detroit in 2026? The median single-family sale price across Metro Detroit (Oakland, Macomb and Wayne counties) was $310,000 in June 2026, up 5.4% year over year, per Realcomp MLS data. Oakland’s median was $395,000, Macomb’s $279,000 and Wayne’s $232,000.
How many homes sold in Oakland County last month? 1,735 single-family homes closed in Oakland County in June 2026, up 9.1% from June 2025, per Realcomp. That was the largest sales increase of Metro Detroit’s three counties.
What’s the most expensive city in Metro Detroit to buy a home? Birmingham. Its June 2026 median sale price was about $1.02 million (Redfin), and its typical Zillow home value is $750,135, the highest of the 15 cities we track. Northville is second by home value at $600,731.
What’s the most affordable Metro Detroit suburb in this report? Warren, where the median June 2026 sale price was $231,000 (Redfin) and the typical Zillow home value is $202,195. Southfield is close behind at a $245,000 median sale price.
Where does this data come from? County figures come from Realcomp II Ltd.’s June 2026 single-family report; city figures from Redfin and Zillow Research (ZHVI); mortgage rates from Freddie Mac via FRED. All figures were pulled July 13, 2026, and every table names its source and period.
Who publishes this report? Top Agent Realty, a Troy-based brokerage serving all of Metro Detroit with 44 agents, 3,319+ transactions and $1B+ in closed volume, publishes this report monthly using Realcomp, Redfin, Zillow Research and FRED data.
Want a single city in depth? See our monthly city reports for Troy, Warren, Sterling Heights, Rochester Hills, Novi, Royal Oak, Livonia, Birmingham, Farmington Hills, Canton, Southfield, Brighton, Rochester, Northville, each updated alongside this report.
Methodology & sources
All data pulled July 13, 2026 by Top Agent Realty. This month’s edition covers June 2026 closings (Zillow values through May 31, 2026; ZHVI publishes on a one-month lag).
- County rollup (Table A): Realcomp II Ltd. “June Single-Family Home Sales Statistical Highlights,” Listing and Sales Summary Report, current as of July 8, 2026. Single-family only. Metro Detroit row = Realcomp’s “Metro Detroit Area” (tri-county). Months of supply computed as active listings ÷ June closed sales; Realcomp reports 2.9 months MLS-wide. Sale-to-list ratios from Redfin county pages (all home types).
- 15-city table (Table B): Redfin city market data, most recent monthly period (June 2026), all home types, so medians will differ modestly from single-family-only figures. Cities under ~40 monthly sales flagged for volatility. Zillow Home Value Index: ZHVI mid-tier, smoothed and seasonally adjusted, city-level CSV from Zillow Research, May 31, 2026 vintage; YoY computed vs. May 31, 2025.
- Shelby Township: Redfin does not publish a usable market page for the charter township (its “Shelby, MI” city region covered 1 June sale), and Realcomp’s city-level statistics are available only through the agent portal. Public aggregators (Rocket Homes, Movoto) report list-side prices, not closed sales, so the sold-side cells are shown as em-dashes rather than approximated; the ZHVI columns are shown. We’ll backfill the sold-side figures from Realcomp city-level stats.
- Rates (Table C): Freddie Mac Primary Mortgage Market Survey via FRED series MORTGAGE30US; monthly figure = average of weekly prints (June 2026: 6.48, 6.52, 6.47, 6.49). Payment formula: P&I = L·r·(1+r)³⁶⁰ ⁄ ((1+r)³⁶⁰ − 1), where L = 80% of median price and r = monthly rate. Excludes taxes, insurance, PMI.
- Cross-check: Realtor.com median days-on-market series via FRED (MEDDAYONMAR26125/26099/26163) show Oakland 32, Macomb 35, Wayne 45 for June 2026. These run higher than Realcomp’s averages because they measure active listings, while Realcomp measures sold homes. We report the sold-side figure.
- Realcomp data is compiled from Michigan’s largest MLS and is deemed reliable but not guaranteed. This report is market analysis, not an appraisal of any individual property.
About the author
Charles Tamou, Broker at Top Agent Realty, Troy, MI. Charles leads Top Agent Realty’s 44 agents, who have closed 3,319+ transactions and more than $1 billion in sales volume across Metro Detroit, earning 1,000+ five-star client reviews. The team publishes this market report monthly from its Troy office at 1985 W Big Beaver Rd, #320. Questions about what these numbers mean for your street? Meet our agents or call the office.
Sources
| Source | What it provided | URL |
|---|---|---|
| Realcomp II Ltd. — June Single-Family Home Sales Statistical Highlights (report current as of 2026-07-08) | Table A: county medians, YoY, closed sales, avg DOM, active listings; MLS-wide totals (11,132 sales; $309,000 record median; 25,885 listings; 2.9 months supply; 99.7% of ask; pendings −4.7%); Detroit city figures; Livingston County; Karen Kage quote | https://realcomp.moveinmichigan.com/News-Events/Feature-2026/July-2026/June-Single-Family-Home-Sales-Statistical-Highlights |
| Redfin — Oakland County housing market | Sale-to-list 100.2%; county trends cross-check | https://www.redfin.com/county/1410/MI/Oakland-County/housing-market |
| Redfin — Macomb County housing market | Sale-to-list 99.7% | https://www.redfin.com/county/1397/MI/Macomb-County/housing-market |
| Redfin — Wayne County housing market | Sale-to-list 99.1% | https://www.redfin.com/county/1429/MI/Wayne-County/housing-market |
| Redfin — city housing-market pages (14 cities; June 2026 medians, YoY, sales, DOM, $/sq ft) | Table B Redfin columns. City page pattern: redfin.com/city/{id}/MI/{City}/housing-market — Troy 20232, Warren 20734, Sterling Heights 19341, Rochester Hills 17662, Northville 15264, Birmingham 2248, Royal Oak 17893, Livonia 12548, Novi 15385, Brighton 2735, Farmington Hills 7011, Rochester 17657, Southfield 18985; Canton via redfin.com/neighborhood/199729/MI/Westland/Canton/housing-market | https://www.redfin.com/city/20232/MI/Troy/housing-market (pattern) |
| Zillow Research — ZHVI city CSV (mid-tier, smoothed, seasonally adjusted), 2026-05-31 vintage | Table B ZHVI + ZHVI YoY, all 15 cities incl. Shelby Township | https://www.zillow.com/research/data/ (file: City_zhvi_uc_sfrcondo_tier_0.33_0.67_sm_sa_month.csv) |
| FRED — MORTGAGE30US (Freddie Mac PMMS) | Table C rates: June 2026 avg 6.49% (weeklies 6.48/6.52/6.47/6.49); June 2025 avg 6.82%; latest print 6.49% (2026-07-09) | https://fred.stlouisfed.org/series/MORTGAGE30US |
| FRED — MEDDAYONMAR26125 / 26099 / 26163 (Realtor.com) | Methodology cross-check: June 2026 listing-side median DOM — Oakland 32, Macomb 35, Wayne 45 | https://fred.stlouisfed.org/series/MEDDAYONMAR26125 |